Wellness ecommerceN36M ad spend -> N187M Meta-generated revenue
Naxa Wellness
How Be Alexander reworked a Meta Ads acquisition system for Naxa Wellness and helped move monthly revenue above prior levels.
Services: Meta Ads, creative testing, reporting, sales performance tracking
The Problem
Naxa Wellness needed a stronger paid acquisition operation for a natural health product portfolio spanning gut health, weight management, hormonal balance, and menstrual wellness.
The business needed better campaign execution, clearer scaling decisions, stronger creative testing, and a system that could connect ad spend to commercial outcomes.
What We Changed
We renovated the advertising operation across campaign architecture, creative testing, audience targeting, day-to-day optimization, and performance reporting.
Creative and copy were developed around direct-response frameworks including AIDA, PAS, and PASTOR across product lines including In My Calm, Hormonal Weight Loss, Belly Shrinker, Gut Power Pro, H. Pylori Protocol, and Digest Well.
We also built a sales allocation and weekly reporting workbook across Clinic Sales and Product Sales units so marketing activity could be reviewed against sales output.
The Result
During the growth period, Naxa Wellness managed approximately N36M in ad spend and generated approximately N187M in Meta-attributed revenue.
Monthly revenue moved from approximately N25M-N30M to above N50M while monthly ad spend increased by only about N2M.
Evidence From The Growth Period
The screenshots below show the operational evidence behind the case study: transaction growth, product-level sales contribution, Shopify sales performance, fulfilled orders, and Meta Ads return patterns.
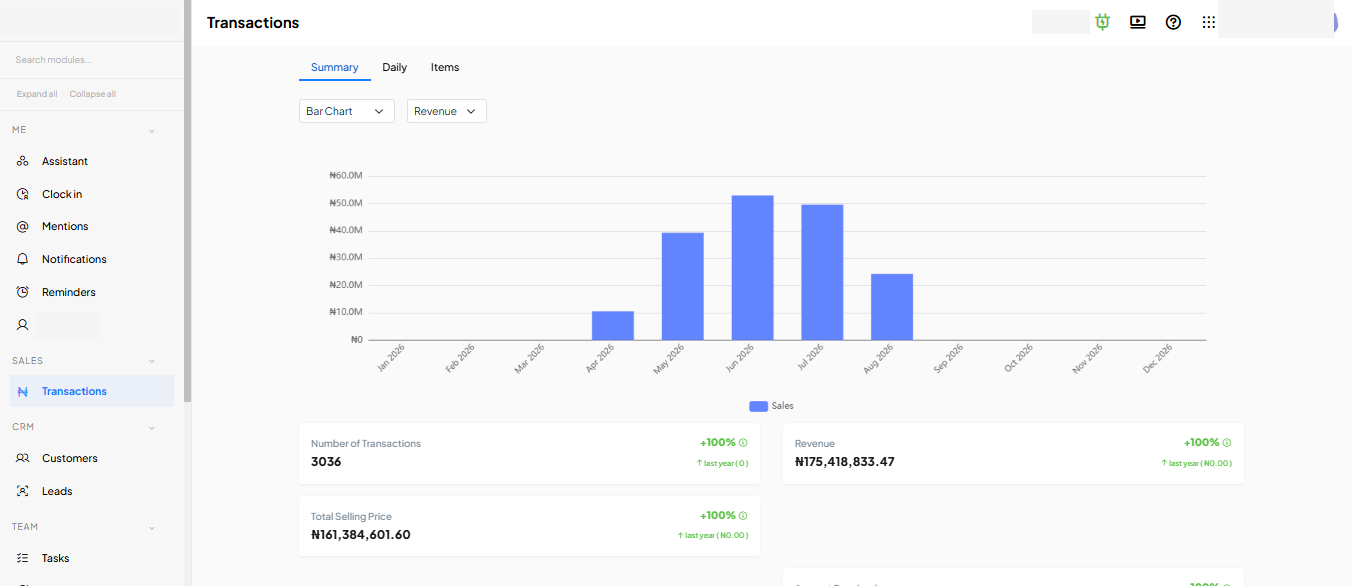
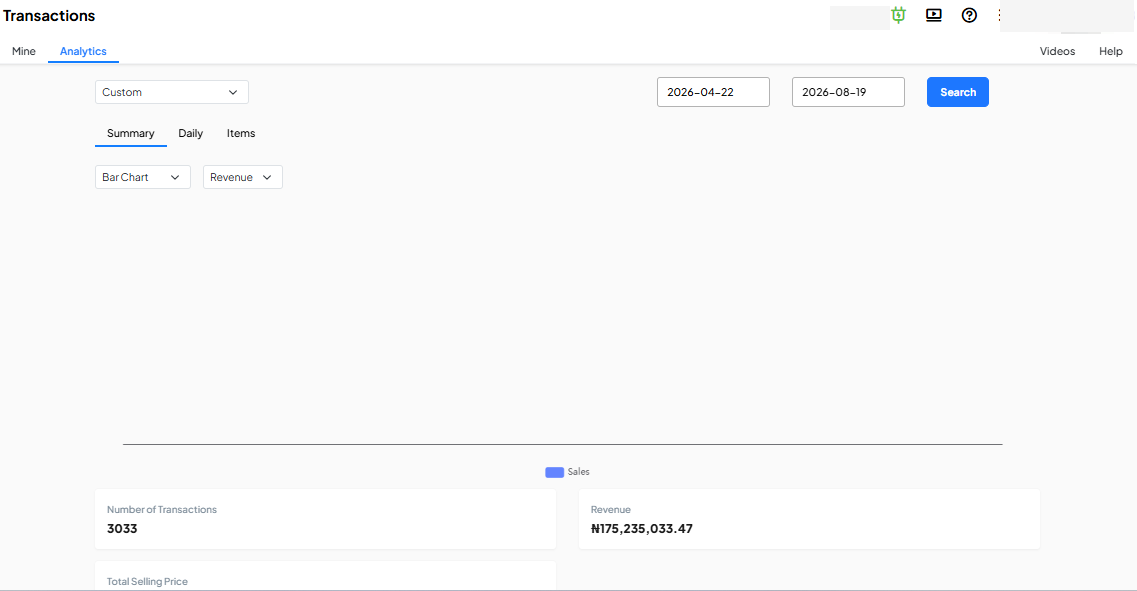
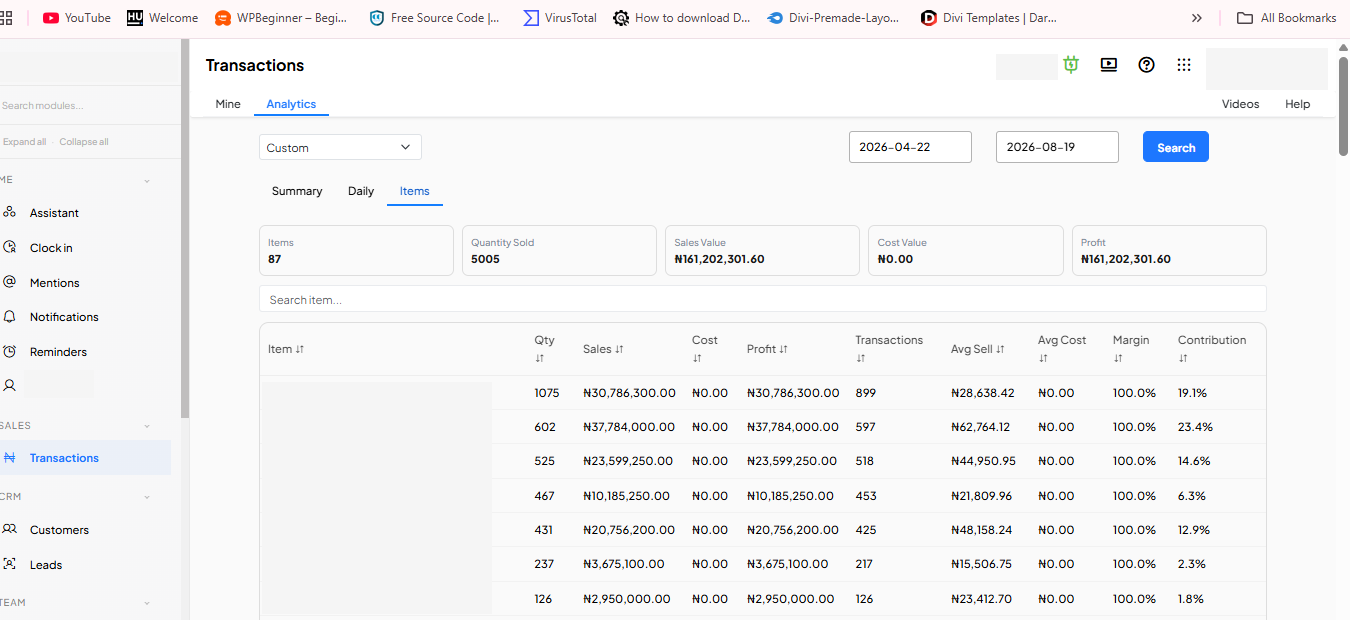
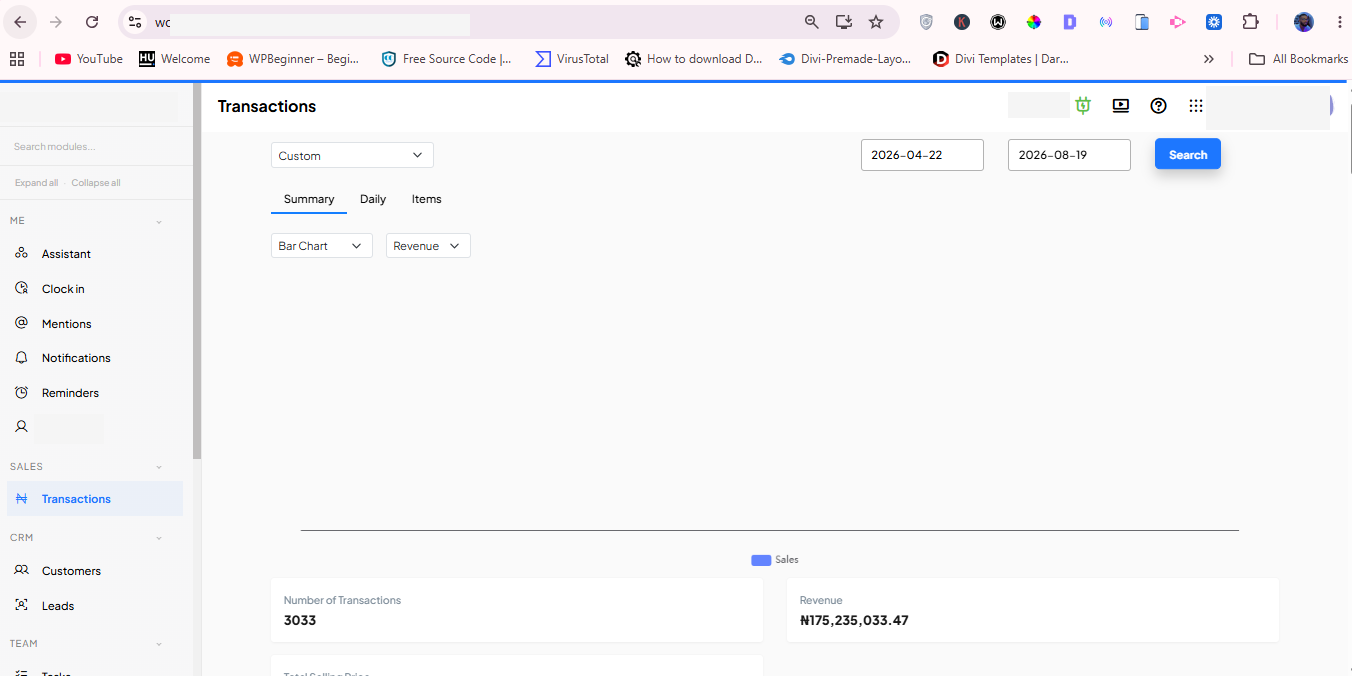
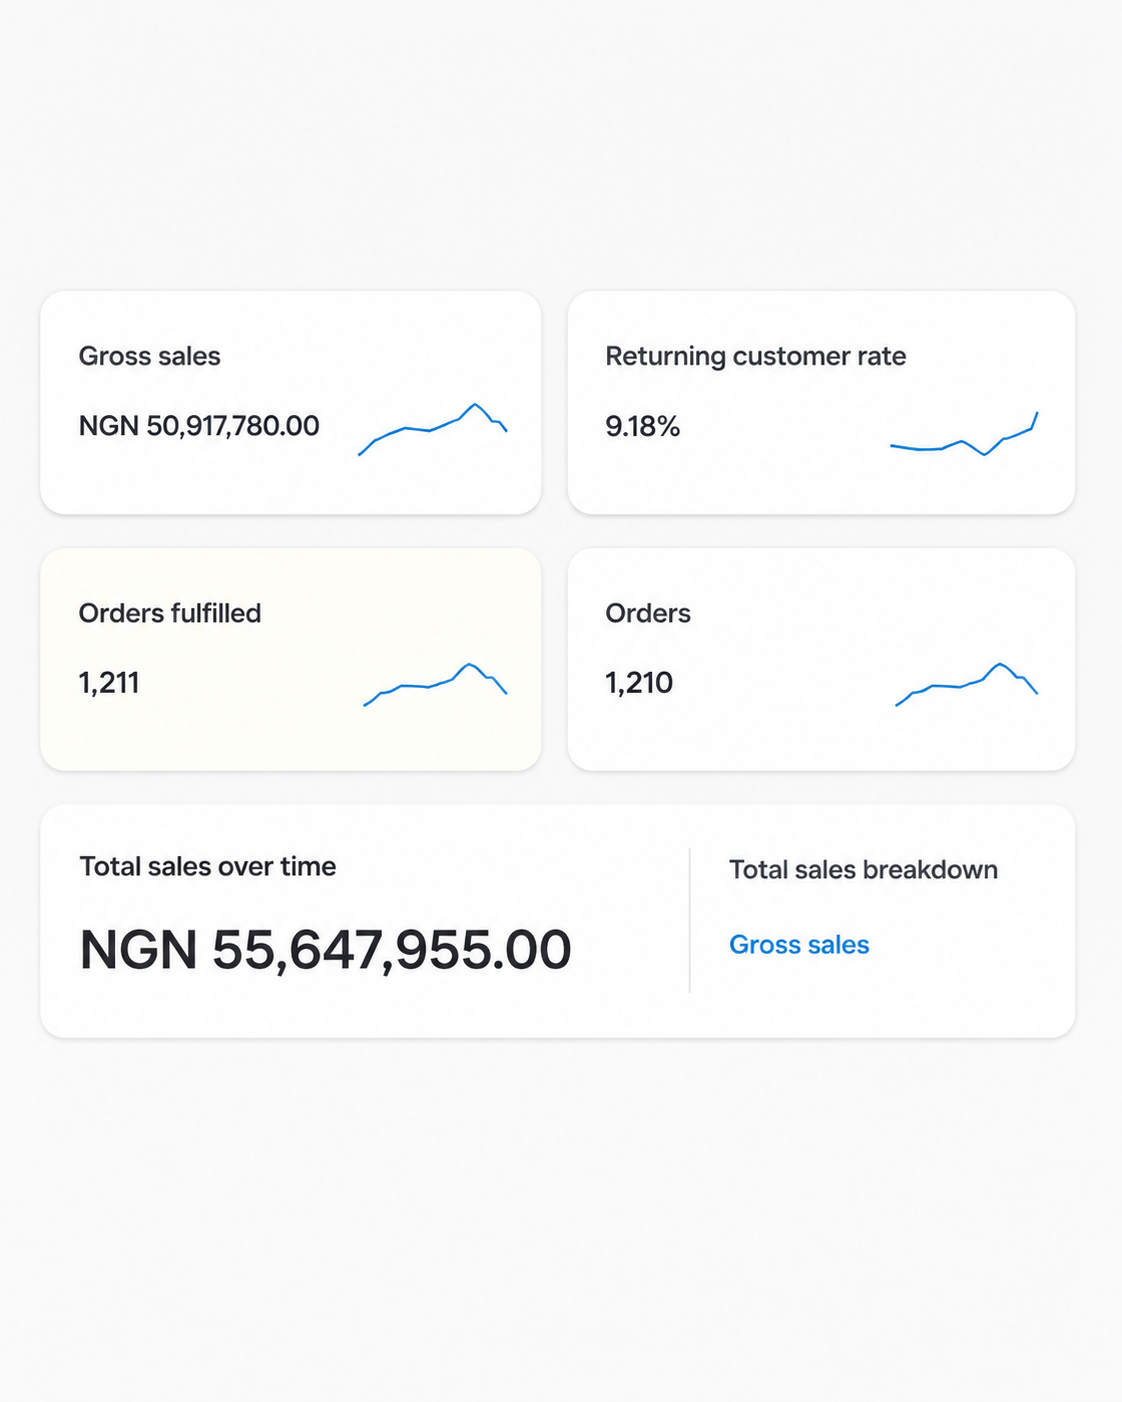
The transactions dashboard shows revenue rising across the measured period, with the strongest months occurring after the paid acquisition system was rebuilt. This was important because the goal was not only to spend more on ads, but to create a clearer connection between campaign execution and actual sales output.The custom-date summary shows more than 3,000 transactions and over N175M in revenue for the selected reporting window. This helped validate that the Meta Ads work was connected to business-level volume, not vanity metrics like impressions or clicks alone.The item breakdown made it easier to see which products were carrying revenue contribution. Products such as Belly Shrinker, Hormonal Weight Loss, H Pylori, Gut Power, and Gut Power Pro could be reviewed by sales value, quantity sold, average selling price, transaction volume, and contribution.This analytics view supported the weekly performance rhythm. By reviewing revenue, transactions, and selling price inside the same system, campaign decisions could be tied back to what the business was actually selling.The Shopify view shows a high-revenue month with N50.9M gross sales, more than 1,200 fulfilled orders, and N55.6M total sales over time. This supported the bigger point in the case study: the account was not only producing ad platform numbers, it was helping create real order volume.The order and fulfillment view matters because paid acquisition can create operational pressure. Seeing 1,211 fulfilled orders alongside gross sales helped show that the growth was moving through the store, not stopping at ad clicks or abandoned carts.
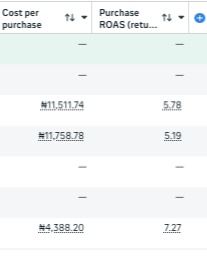
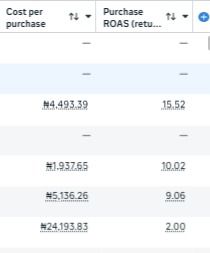
Meta Ads reporting samples showed purchase ROAS levels above 5x and 7x in selected campaign views, giving the team signals about which campaign areas were worth protecting or scaling.Additional Meta reporting showed even stronger pockets of return, including views above 9x, 10x, and 15x ROAS. These were not treated as isolated screenshots; they were used as directional evidence alongside revenue, transaction, and product-level reporting.
The Shopify KPI strip brought the business outcome back into view: gross sales, returning customer rate, orders fulfilled, and total sales over time. This helped keep optimization focused on profitable customer acquisition and operational throughput.
Key Numbers
N36M ad spend managed
N187M Meta-generated revenue
Approximately 5.2x ROAS
Monthly revenue grew from around N25M-N30M to above N50M
Campaign architecture, creative testing, audience targeting, and reporting were rebuilt
More than 3,000 transactions visible in the selected reporting period
More than 1,200 fulfilled orders visible in the Shopify sales view